Analysis of the organization’s product portfolio
The goal of every organization is to generate a profit. An organization achieves profit by selling its products in a market where competition is also present. Therefore, the organization must conduct regular analysis of its product portfolio to determine the market position of its products, how they are selling, and their profitability. Based on this, it can then identify and implement measures to maintain or improve its market position, and subsequently maintain or even increase the organization’s profit.
A product refers to a good, a custom order, or a service that the organization manufactures, executes, or provides.
Profitability Analysis
For a basic analysis of product profitability, it is sufficient to prepare an overview in a table where the products are sorted from the highest profitability to the lowest. For a better visual representation, you can then create, for example, a bar chart.
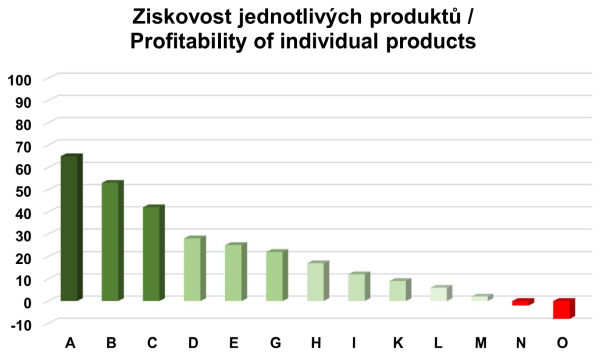
However, it is equally important to know the volume in which individual products are sold. (For organizations with a very diverse product range, tracking can be done via revenue.) Again, it is enough to create a simple product overview and a corresponding bar chart.
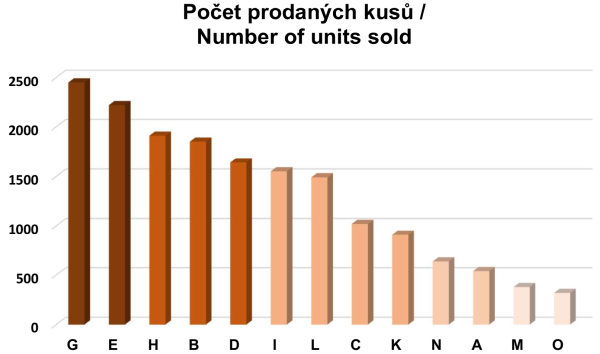
From these two separate bar charts, it is not easy at first glance to determine which product is the best and which is the worst for the organization in terms of the ‚total‘ of these two parameters. Therefore, it is appropriate to use a more sophisticated tool for the analysis that compares the products from the perspective of both profitability and units sold simultaneously. This tool is the HOPW matrix, which helps categorize products into 4 groups:
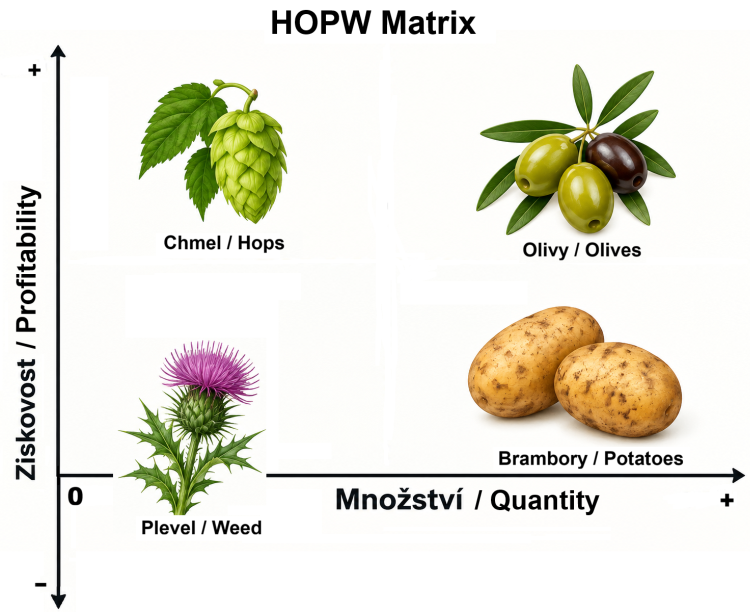
Products with high profitability but sold in small quantities (Hops). These can be hot new releases that the organization is launching on the market and which customers are eagerly anticipating. The goal for these products is subsequently to move them into the olives group. However, they can also be products that have a narrow customer base and, due to their specificity and a limited market, are not as heavily threatened by competitive interest. This allows the organization to maintain a higher price level. For organizations, some products from this group can be a matter of prestige from a marketing perspective.
Products with high profitability and sold in large quantities (Olives) – the best possible scenario for the organization. However, these products are often threatened by the competitive environment, and there is a relatively high risk that they will slide into the third group (Potatoes).
Products sold in large quantities but with low profit (Potatoes). These are products designed for a large customer base, or they are former Group 1 products (e.g., olives) whose profitability has dropped due to strong competition. These products are very important for the company because they often ensure stable revenues for the organization.
Products sold in relatively small quantities and with minimal profit or even at a loss (Weed). These may be products from unsuccessful projects, products that are no longer „in“, or products that did not survive fierce competition. The logical goal is to get rid of such products as quickly as possible.
I will mention 2 cases where these products from the weeds group are tolerated in the portfolio:
- The organization has a customer who requires such a product while the organization also supplies them with 5, 10, or more other products from the three previous groups. If the product is not delivered in large volumes, it is tolerated (acting as a sort of reward for loyalty and long-term cooperation).
- The organization invests in capacity expansion. In such cases, it is possible – and often necessary – to produce these products so they can absorb at least the fixed costs. This is done until enough new orders are secured for products from the hops, potatoes, or ideally, olives groups.
How to create a HOPW matrix (chart)?
It is simple:
- Create a table in a spreadsheet program like Calc, Excel, etc., where the products are sorted by profitability -including, of course, the profitability percentage.
- In the next column of the table, enter the number of units sold for the selected/monitored period.
- Select a scatter plot from the spreadsheet program’s menu.
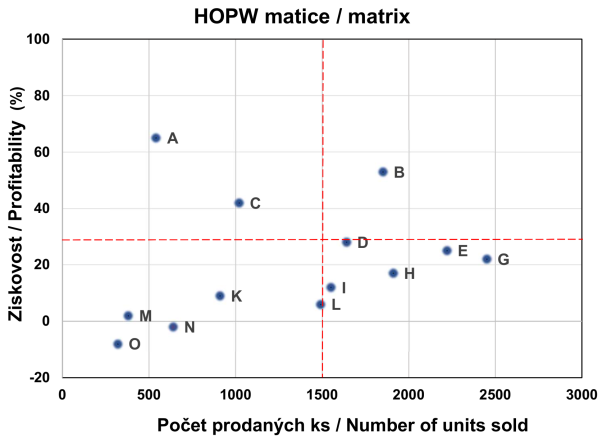
- Format the chart into a presentable form, which means adjusting the axis scales, adding product labels, etc. Most importantly, add the boundaries between high and low profitability, and between small and large quantities. In the vast majority of cases, this boundary is not the exact midpoint between the maximum and minimum values.
An example of what the HOPW matrix can look like for products A through O, which were shown in the bar charts at the beginning:
Interpretation of Product Portfolio Analysis Results:
If the organization has few products in the hops group, it may indicate that its new product development is insufficient. And if it develops many new products but they end up among the weeds and potatoes, it may suggest that the organization is incorrectly identifying and reviewing customer requirements, failing to promote new products adequately, or achieving lower product profitability due to higher-than-expected costs.
For products in the potatoes group, it is necessary to look for ways to reduce production/execution costs and potentially innovate the products to prevent them from falling into the weeds group.
If the organization has a high share of products in the olives group (and potentially the hops group) supported by a surplus of orders, this serves as an incentive to invest in expanding production capacities.
Conversely, if the organization has a high share of products in the weeds and potatoes groups, investing in expanding production capacities is risky (especially if funded by external sources) because there is a high risk that the organization will struggle to repay the investment.
The Importance of Product Portfolio Analysis
Product portfolio analysis serves as a basis for decision-making regarding investments, innovations, increasing production process efficiency (including reducing defect rates), new product development, and sales strategy… all with the goal of maintaining or improving market position while simultaneously maintaining or improving the organization’s profitability.
Autor: © Martin Dudek Datum: březen 2019
Česká verze článku ZDE.